Objective
The goal is to build a dynamic, time-based performance report that allows users to select a custom date range, which will be treated as the current year (CY). For example, if a user selects 01-Jan-2025 to 06-May-2025, the system will treat this as the current period and automatically compare it against the same period from the previous year (01-Jan-2024 to 06-May-2024).
The report will showcase key metrics such as:
- % Achievement (e.g., how much of the 2025 budget was achieved),
- Shortfall (e.g., if budgeted sales were ₹10 lakhs but actual was ₹6 lakhs, shortfall is ₹4 lakhs),
- Growth % (e.g., comparing ₹6 lakhs in 2025 vs ₹5 lakhs in 2024 = 20% growth)
These metrics will be displayed across time intervals like monthly, quarterly, or weekly.
In this use case, the Bakery category will be highlighted as the focus area, allowing users to monitor its performance separately from the overall sales across all product categories.
Requirement
A dynamic time-based report is needed to analyze sales performance with the following features:
- Allow selection of a custom date range using From Date and To Date inputs.
For example, user selects From: 01-Jan-2025 and To: 06-May-2025 to view current period performance. - Display Sales and Budget values for both all categories (Total) and the Bakery category.
For example, if the user selects From: 01-Jan-2025 to 06-May-2025, the report will show sales and budget values for all product categories and for Bakery separately. - Show % Achievement, which indicates how much of the budgeted sales were achieved.
For example, if sales are ₹4,72,000 and budget is ₹9,00,000 in Q1, then % Achievement = 52.44%. - Show Shortfall, which highlights the gap between sales and the budget.
For example, Bakery budget = ₹3,30,000, Bakery sales = ₹2,20,000 → Shortfall = -₹1,10,000. - Include Previous Year Sales for the same date range to support year-over-year analysis.
For example, for the selected range 01-Jan-2025 to 06-May-2025, the previous year comparison will automatically map to 01-Jan-2024 to 06-May-2024. - Show Growth %, which represents the sales improvement or decline compared to the previous year.
For example, CY Sales = ₹7,12,000, PY Sales = ₹6,50,000 → Growth % = 9.54%. - Present all data in a quarter-wise tabular layout for better trend visibility.
How Quarter Assignment Works:
Even though the user selects a custom date range (e.g., 01-Jan-2025 to 06-May-2025), the system will split this range into quarters based on the calendar definition:- Dates from 01-Jan to 31-Mar are tagged as Q1
- Dates from 01-Apr to 30-Jun are tagged as Q2, and so on.
For example, in the above case:
- Sales from Jan to Mar 2025 are grouped under Q1
- Sales from Apr to 06-May-2025 are grouped under Q2 (partial)
This allows the report to compare the same partial quarters across both years.
- CY Q2 will include data up to 06-May-2025
- PY Q2 will include data up to 06-May-2024
This approach ensures accurate comparison even when the selected range spills across two quarters.
- Ensure the report updates dynamically based on the selected date range.
For example, if the user changes the date range to 01-Apr-2025 to 30-Jun-2025, the report will automatically update to reflect only Q2 performance metrics. - Highlight the Bakery category separately, as it is a key focus area for comparison against all categories.
For example, separate columns will be shown for CY Bakery Sales, CY Bakery Budget, PY Bakery Sales, and all Bakery-specific performance indicators.
- Ensure the report updates dynamically based on the selected date range.
About the Use case
This use case focuses on building a dynamic, quarter-wise performance report that compares budgeted vs. actual sales across both total product categories and a specific focus category — Bakery. The report is designed to respond to user-selected date ranges and support year-over-year comparisons, making it flexible, insightful, and actionable.
While the final output presents standard performance metrics like Achievement %, Shortfall, and Growth %, the real value lies in how filters are applied behind the scenes to make the report dynamic. This section explains the filter logic with clear examples and shows how the raw data is transformed into meaningful insights.
1. Custom Date Range Filter (From Date – To Date)
The report accepts a custom date range input using two parameters: From Date and To Date. This range is treated as the Current Year (CY) period, and the system automatically computes the corresponding Previous Year (PY) period by subtracting one year from both dates.
For Example:
- Selected range (CY): 01-Jan-2025 to 06-May-2025
- Auto-derived range (PY): 01-Jan-2024 to 06-May-2024
Sales records within these two ranges are filtered from the dataset to populate the CY and PY sections of the report. This ensures that the report always compares the same calendar span across two years, regardless of what quarter or months the user selects.
2. Product Category Filter – Focus on Bakery
In addition to overall sales, the report tracks a focus product category — in this case, Bakery — separately. Filters are applied on the Product Category column to isolate Bakery-specific values for:
- Sales (CY and PY)
- Budget (CY)
- Derived metrics like Achievement %, Shortfall, and Growth %
This enables decision-makers to monitor key product lines independently while still having visibility over overall business performance.
3. Quarter Identification Logic
To facilitate trend visibility, each record is assigned to a calendar quarter (Q1, Q2, etc.), based on its transaction or budget date. This is achieved by creating a derived “Quarter” column from the date field.
For Example:
- Records from 01-Jan to 31-Mar are tagged as Q1
- Records from 01-Apr to 30-Jun are tagged as Q2
- Partial quarters are handled seamlessly based on the date range selected
This allows the final report to organize data quarter-wise, even when the selected date range doesn’t span full quarters.
4. Sample Input Tables
The following tables provide a snapshot of the raw input data used in the report.
Sales Data:
Transaction Date | Product Category | Sales |
01-01-2024 | Bakery | 80,000 |
11-02-2024 | Beverages | 60,000 |
18-03-2024 | Snacks | 50,000 |
15-02-2024 | Bakery | 90,000 |
13-01-2024 | Beverages | 70,000 |
15-03-2024 | Snacks | 55,000 |
01-04-2024 | Bakery | 100,000 |
05-05-2024 | Beverages | 85,000 |
08-06-2024 | Snacks | 60,000 |
01-01-2025 | Bakery | 100,000 |
11-02-2025 | Beverages | 65,000 |
18-03-2025 | Snacks | 52,000 |
15-02-2025 | Bakery | 120,000 |
13-01-2025 | Beverages | 75,000 |
15-03-2025 | Snacks | 60,000 |
01-04-2025 | Bakery | 150,000 |
05-05-2025 | Beverages | 90,000 |
08-06-2025 | Snacks | 70,000 |
Budget Data:
Budget Month Date | Product Category | Budget Amount |
01-01-2025 | Bakery | 1,00,000 |
01-01-2025 | Beverages | 90,000 |
01-01-2025 | Snacks | 80,000 |
01-02-2025 | Bakery | 1,10,000 |
01-02-2025 | Beverages | 95,000 |
01-02-2025 | Snacks | 85,000 |
01-03-2025 | Bakery | 1,20,000 |
01-03-2025 | Beverages | 1,00,000 |
01-03-2025 | Snacks | 90,000 |
01-04-2025 | Bakery | 1,30,000 |
01-04-2025 | Beverages | 1,10,000 |
01-04-2025 | Snacks | 95,000 |
01-05-2025 | Bakery | 1,40,000 |
01-05-2025 | Beverages | 1,20,000 |
01-05-2025 | Snacks | 1,00,000 |
01-06-2025 | Bakery | 1,50,000 |
01-06-2025 | Beverages | 1,30,000 |
01-06-2025 | Snacks | 1,10,000 |
01-07-2025 | Bakery | 1,60,000 |
01-07-2025 | Beverages | 1,40,000 |
01-07-2025 | Snacks | 1,20,000 |
01-08-2025 | Bakery | 1,70,000 |
01-08-2025 | Beverages | 1,50,000 |
01-08-2025 | Snacks | 1,30,000 |
01-09-2025 | Bakery | 1,80,000 |
01-09-2025 | Beverages | 1,60,000 |
01-09-2025 | Snacks | 1,40,000 |
01-10-2025 | Bakery | 1,90,000 |
01-10-2025 | Beverages | 1,70,000 |
01-10-2025 | Snacks | 1,50,000 |
01-11-2025 | Bakery | 2,00,000 |
01-11-2025 | Beverages | 1,80,000 |
01-11-2025 | Snacks | 1,60,000 |
01-12-2025 | Bakery | 2,10,000 |
01-12-2025 | Beverages | 1,90,000 |
01-12-2025 | Snacks | 1,70,000 |
Final Output Table (Post Filter Application)
After filters and transformations are applied, the report generates a quarter-wise summary with key metrics, calculated separately for Total and Bakery categories.
Quarters | CY Total Budget | CY Bakery Budget | CY Total | CY Bakery | Total % Achievement | Bakery % Achievement | Total Shortfall(+/-) | Bakery Shortfall(+/-) | PY Total | PY Bakery | Total Growth %% | Bakery Growth % |
Q1 | 9,00,000 | 3,30,000 | 472,000 | 2,20,000 | 52.44% | 66.66% | -4,28,000 | -1,10,000 | 4,05,000 | 1,70,000 | 16.54% | 29.41% |
Q2 | 10,20,000 | 4,20,000 | 240,000 | 150,000 | 23.53% | 35.71% | -7,80,000 | -2,70,000 | 2,45,000 | 1,00,000 | -2.04% | 50.00% |
Q3 | 9,90,000 | 5,10,000 |
|
|
|
|
|
|
|
|
|
|
Q4 | 10,20,000 | 6,00,000 |
|
|
|
|
|
|
|
|
|
|
Total | 39,30,000 | 18,60,000 | 7,12,000 | 3,70,000 | 18.11% | 19.89% | -32,18,000 | -14,90,000 | 6,50,000 | 2,70,000 | 9.54% | 37.04% |
Solution:
To create a Quarterly Budget vs Sales Report with the given sales data, follow these logical steps.
The following are the logical steps:
- Combine Budget and Sales data into a single dataset.
- Create a quarter column using the first date of the quarter from the date column.
- Add a Previous Year Date column for comparing current vs previous year.
- Create a tabular report with the columns: Quarter, Total Sales, Bakery Sales, Total Budget, and Bakery Budget.
- Now pass the filter
- Apply the Date Range filter (From Date – To Date) to the Sales column to ensure only transactions within the selected period are considered.
- Add a filter for a specific product category so that both the Sales and Budget values only show data for that category.
Note: In our case, we are focusing on the Bakery category.
6. Add calculated columns :
- Achievement %: (CY Sales ÷ CY Budget) × 100
- Shortfall: CY Sales - CY Budget
- Growth %: ((CY Sales– PY Sales) / PY Sales) × 100
Note: The selected date range 01-Jan-2025 to 06-May-2025 is considered as the current period (CY), and the system compares it with the same period in the previous year (PY) (01-Jan-2024 to 06-May-2024).
Now we will implement same in smarten
We are implementing this use case in two parts:
- Dataset (SSDP)
Tabular report
SSDP :
1. Creating a Sales Dataset - The table displays sales data by transaction date and product category
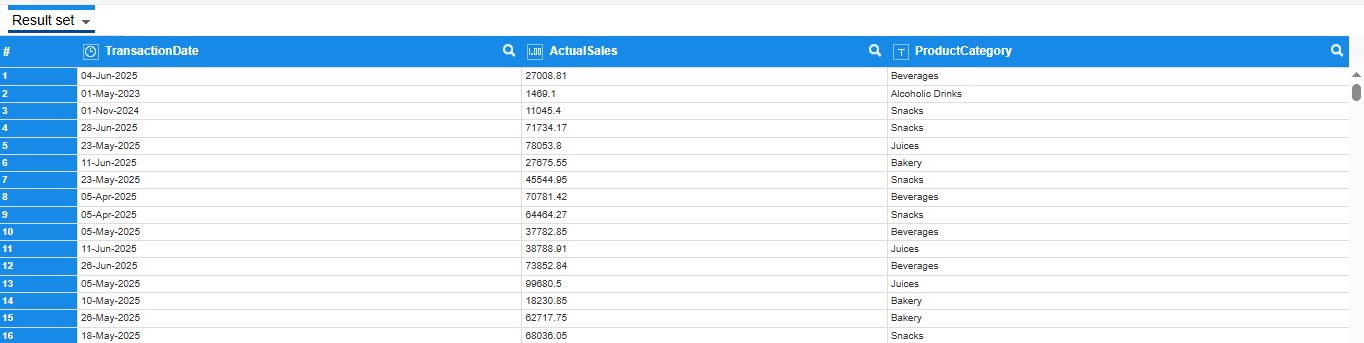
1.1 Sales Dataset
Creating a Budget Dataset - The table displays Budget data by Month date and product category.
 1.2 Budget Dataset
Adding the Budget dataset in SSDP for appending with the Sales dataset
 1.3 Adding Budget Dataset
Appending Budget Data to Sales Dataset - We are appending the Budget dataset with the Sales dataset instead of joining because joining causes budget values to repeat for the same month across multiple transactions, resulting in incorrect totals. Although this can be fixed using a distinct operation at the front-end, it may increase object load time. To avoid this, we append the datasets by mapping Product Category to Product Category and Transaction Date to Budget Month Date, and include Budget and Sales columns separately.
 1.4 Appending Budget Dataset
Sales Dataset After Append

1.5 Sales Dataset After Append
2. Adding the Custom Quarter Column -
We are adding the Quarter column because the report requires Sales, Budget Data, and Performance Metrics to be analyzed on a quarterly basis.
To achieve this, we derive the quarter (Q1, Q2, Q3, Q4) from the Transaction Date by creating a custom column using the "Quarter Name" option from the date column (Right-click → Add Column → Quarter Name).
2.1 Adding Quarter Column
Dataset with Quarter Column Added

2.2 Dataset with Quarter Column Added
3. Adding the Custom Previous Year Column -
This column is required to fetch previous year data based on the selected date range.
Right-click on any column, select "Add Column", then choose the "Custom" option.
3.1 Adding Previous Year Column
The expression dateAdd("y", 1, TransactionDate) adds 1 year to the TransactionDate.
To get the Previous Year date, you should subtract 1 year instead: 3.2 Previous Year Column Expression
Final Dataset for Dynamic Sales vs. Budget Report
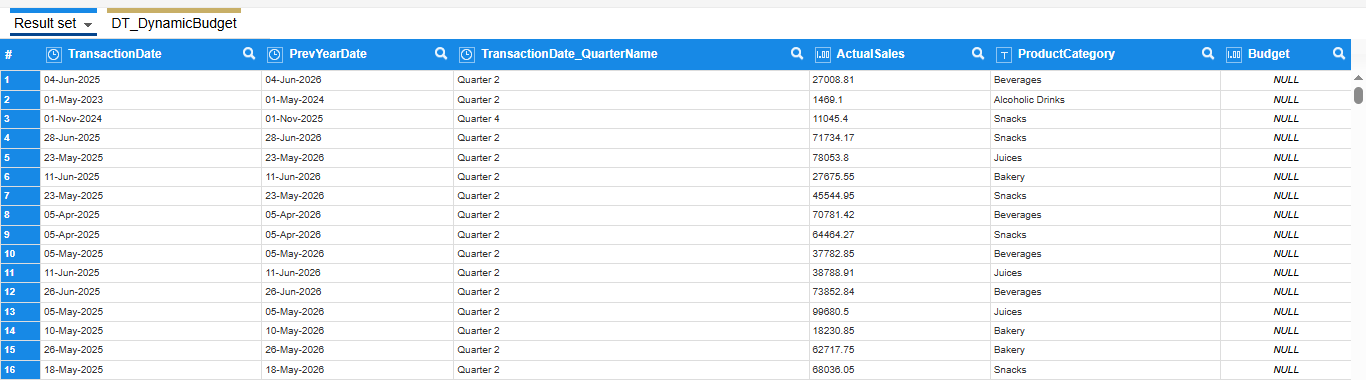
Final Dataset
Tabular Report :
4. Creating a Tabular Object
We are adding all required columns in the Outliner - Quarter, Budget (twice for Total and Bakery), and Sales (four times for CY and PY, both Total and Bakery) - and applying filters for each condition. We have also renamed the columns appropriately in the report to ensure clarity.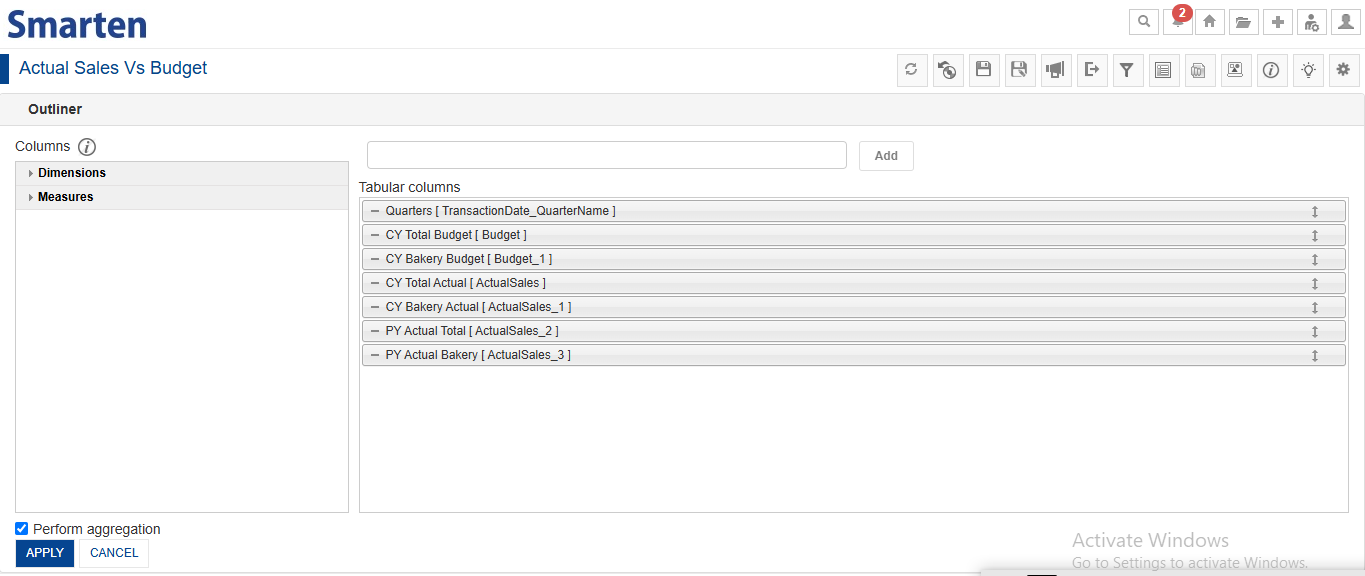
4.1 Outliner
This is a report without applying any filter conditions.

4.2 Tabular Report
5. Applying Filters to the Bakery Column
We are applying filters because they will filter the data based on the specified conditions.
We are opening the filter window, creating a dataset filter with a condition on the Transaction Date for the current year, and setting up an additional filter for the Bakery category. This filter is applied to the CY Bakery Budget, CY Bakery Sales, and PY Bakery Sales columns. If the filter conditions are not met, we set CY Total Budget and CY Bakery Budget to 0; otherwise, we display the dataset values. 5.1 Current Year Filter
5.2 Bakery Category Filter
Creating Global Variables for Dynamic Date Range for Total and Bakery sales
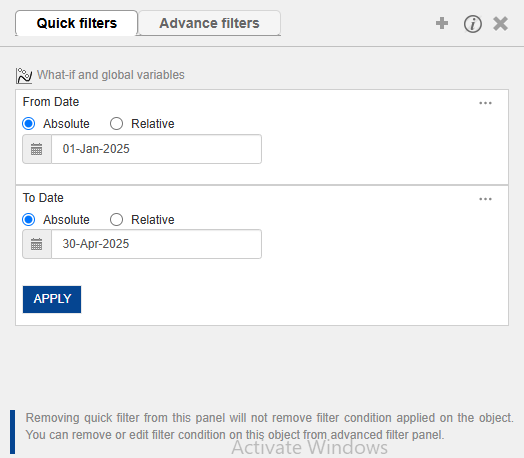
We are creating the From Date and To Date global variables because we need to pass a date range and filter the data accordingly. So, we first need to create global variables to use them in the date range filter.
We are opening the Manage Global Variable window, clicking on “Create New,” and defining two variables - From Date and To Date - to filter the Transaction Date for Sales reporting.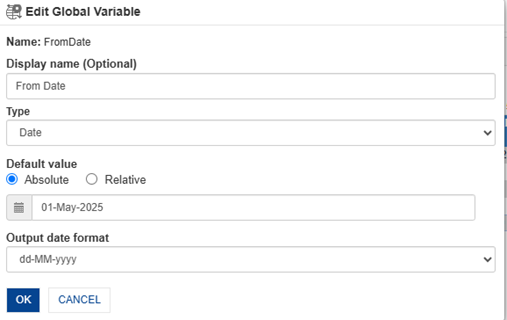
5.3 Creating From Date Global variable
5.4 Creating To Date Global variable
Dynamic Date Range Filtering for CY Total and Bakery Sales
Here we are creating the date range filter for the given Transaction Date range, which we are referring to as the Current Year.
We are applying the passed date range filter to CY Total Sales and CY Bakery Sales by creating a dataset filter using the global From Date and To Date variables on the Transaction Date column, and applying it to both columns—showing the values if the condition matches, otherwise setting them to 0.

5.5 Passing the Date Range

5.6 Adding Condition for Current Year

5.7 Creating a Transaction Date filter for Date Range
Dynamic Date Range Filtering for PY Total and Bakery Sales
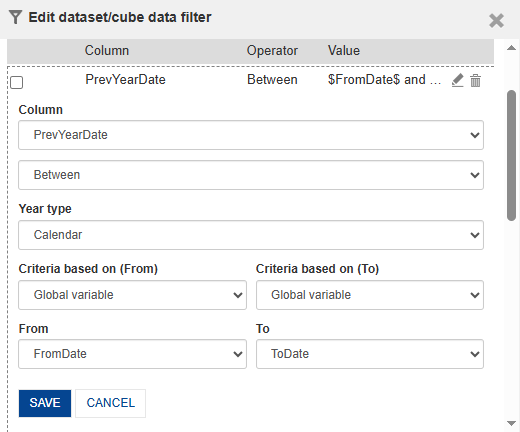
Here we are applying the filter on the Previous Year date column to filter out the previous year values for performance comparison.
We are applying the passed date range filter to PY Total Sales and PY Bakery Sales by creating a dataset filter using the global From Date and To Date variables on the Previous Year Date column, and applying it to both columns — displaying values if the condition matches, otherwise setting them to 0.
5.8 Passing the Date Range
5.9 Adding Condition for Previous Year

5.10 Creating a Previous Year Date filter for Date Range
6. Creating Custom Measure (UDDC) Columns
We are creating the performance metric columns, which are necessary to assess performance and support decision-making.
We are going to the Manage Custom Measure (UDDC) window and creating Calculated Fields by clicking “Add,” providing a name, selecting the base column, and entering the required calculation expression.
6.1 Manage Custom Measure (UDDC) Window
Use the following expressions in Manage Custom Measure (UDDC) by creating new calculated fields with the given column names, then add each one to the Outliner:
- Total % Achievement
( [CY Total Sales] / [CY Total Budget] ) * 100
- Bakery % Achievement
( [CY Bakery Sales] / [CY Bakery Budget] ) * 100
- Total Shortfall(+/-)
[CY Total Sales] - [CY Total Budget]
- Bakery Shortfall(+/-)
[CY Bakery Sales] - [CY Bakery Budget]
- Total Growth %
( [CY Total Sales] - [PY Total Sales] ) / [PY Total Sales] * 100
- Bakery Growth %
( [CY Bakery Sales] - [PY Bakery Sales] ) / [PY Bakery Sales] * 100
Expected Output :
We have got the expected output; all columns with correct values are shown below.

7.1 Budget vs Sales Report
Conclusion:
This use case demonstrates how dynamic, date-driven reporting can deliver deeper insights into sales performance by enabling real-time comparisons of actual sales vs. budget across both total business and specific product categories.
By applying flexible custom date range filters, calculating key metrics such as % Achievement, Shortfall, and Growth %, and organizing the data quarter-wise, the solution allows users to:
- Monitor sales performance against budgets across any chosen time frame
- Compare current-year results with equivalent periods from the previous year
- Isolate and evaluate specific product categories like Bakery alongside total results
- Visualize trends, gaps, and growth opportunities in a structured and clear format
The report structure is scalable and reusable, making it well-suited for performance reviews, business planning, or monthly and quarterly reporting workflows. With filters and calculated fields integrated into the dataset, the report remains responsive to user selections, ensuring meaningful and relevant outputs every time.
Tags: Budget vs Actual Sales, Sales Analysis, Sales performance, Quarterly Sales Report, YoY Sales Analysis, Custom Date Range, Flexible Date Selection, Year over Year Comparison, Weekly Sales Trends, Shortfall Analysis, Sales Gap Analysis,
Was this article helpful?
That’s Great!
Thank you for your feedback
Sorry! We couldn't be helpful
Thank you for your feedback
Feedback sent
We appreciate your effort and will try to fix the article